Design Considerations
Failure Modes
Broadly speaking, the goal of a design is to prevent unwanted behaviors (or failure modes) from occurring. There can be, and usually are, many different failure modes which need to be considered simultaneously.
For example, consider just 2 plates bolted together and loaded to failure:
It is the job of the engineer to anticipate and design for all relevant failure modes. For a given design, successful operation may require:
- Stresses stay below material limits (see Von Mises failure criteria )
- Stress from cyclic loading stays below the fatigue limit (see the Fatigue reference page )
- Buckling is prevented (see the Buckling reference page )
- Deformation stays below a prescribed limit (see the Beam Deflection reference page )
- Vibration deformation from dynamic loads stays below a prescribed limit
- And more
Any way a product or component can fail to meet the desired performance can be referred to as a failure mode. These are occasionally categorized as
- Strength: exceeding the limit state results in material failure
- Stability: exceeding the limit state results in a stability failure (like buckling or overturning)
- Serviceability: exceeding the limit state results in compromised performance (excessive deflection)
It can be very difficult to anticipate every possible failure mode. This broad view of component performance is discussed in the Product Design Specifications reference page. In solid mechanics, we’ll focus on the strength failure modes.
Note that the nomenclature can vary between industries, but the intent is the same, to identify potential failures and design to prevent them, or reduce the risk (probability x severity) to an acceptably low level.
Allowable Strength Design
Design Requirement: A structural design is intended to support and/or transmit loads while maintaining safety and utility: don't break. Strength of a structure reflects its ability to resist failure.- Ultimate load ( \( P_u \) ): force when specimen fails (breaks).
- Ultimate normal stress ( \( \sigma_u \) ): stress when a specimen fails (breaks).
Factor of Safety (FS): Ratio of structural strength to maximum (allowed) applied load (\( P_{all} \)).
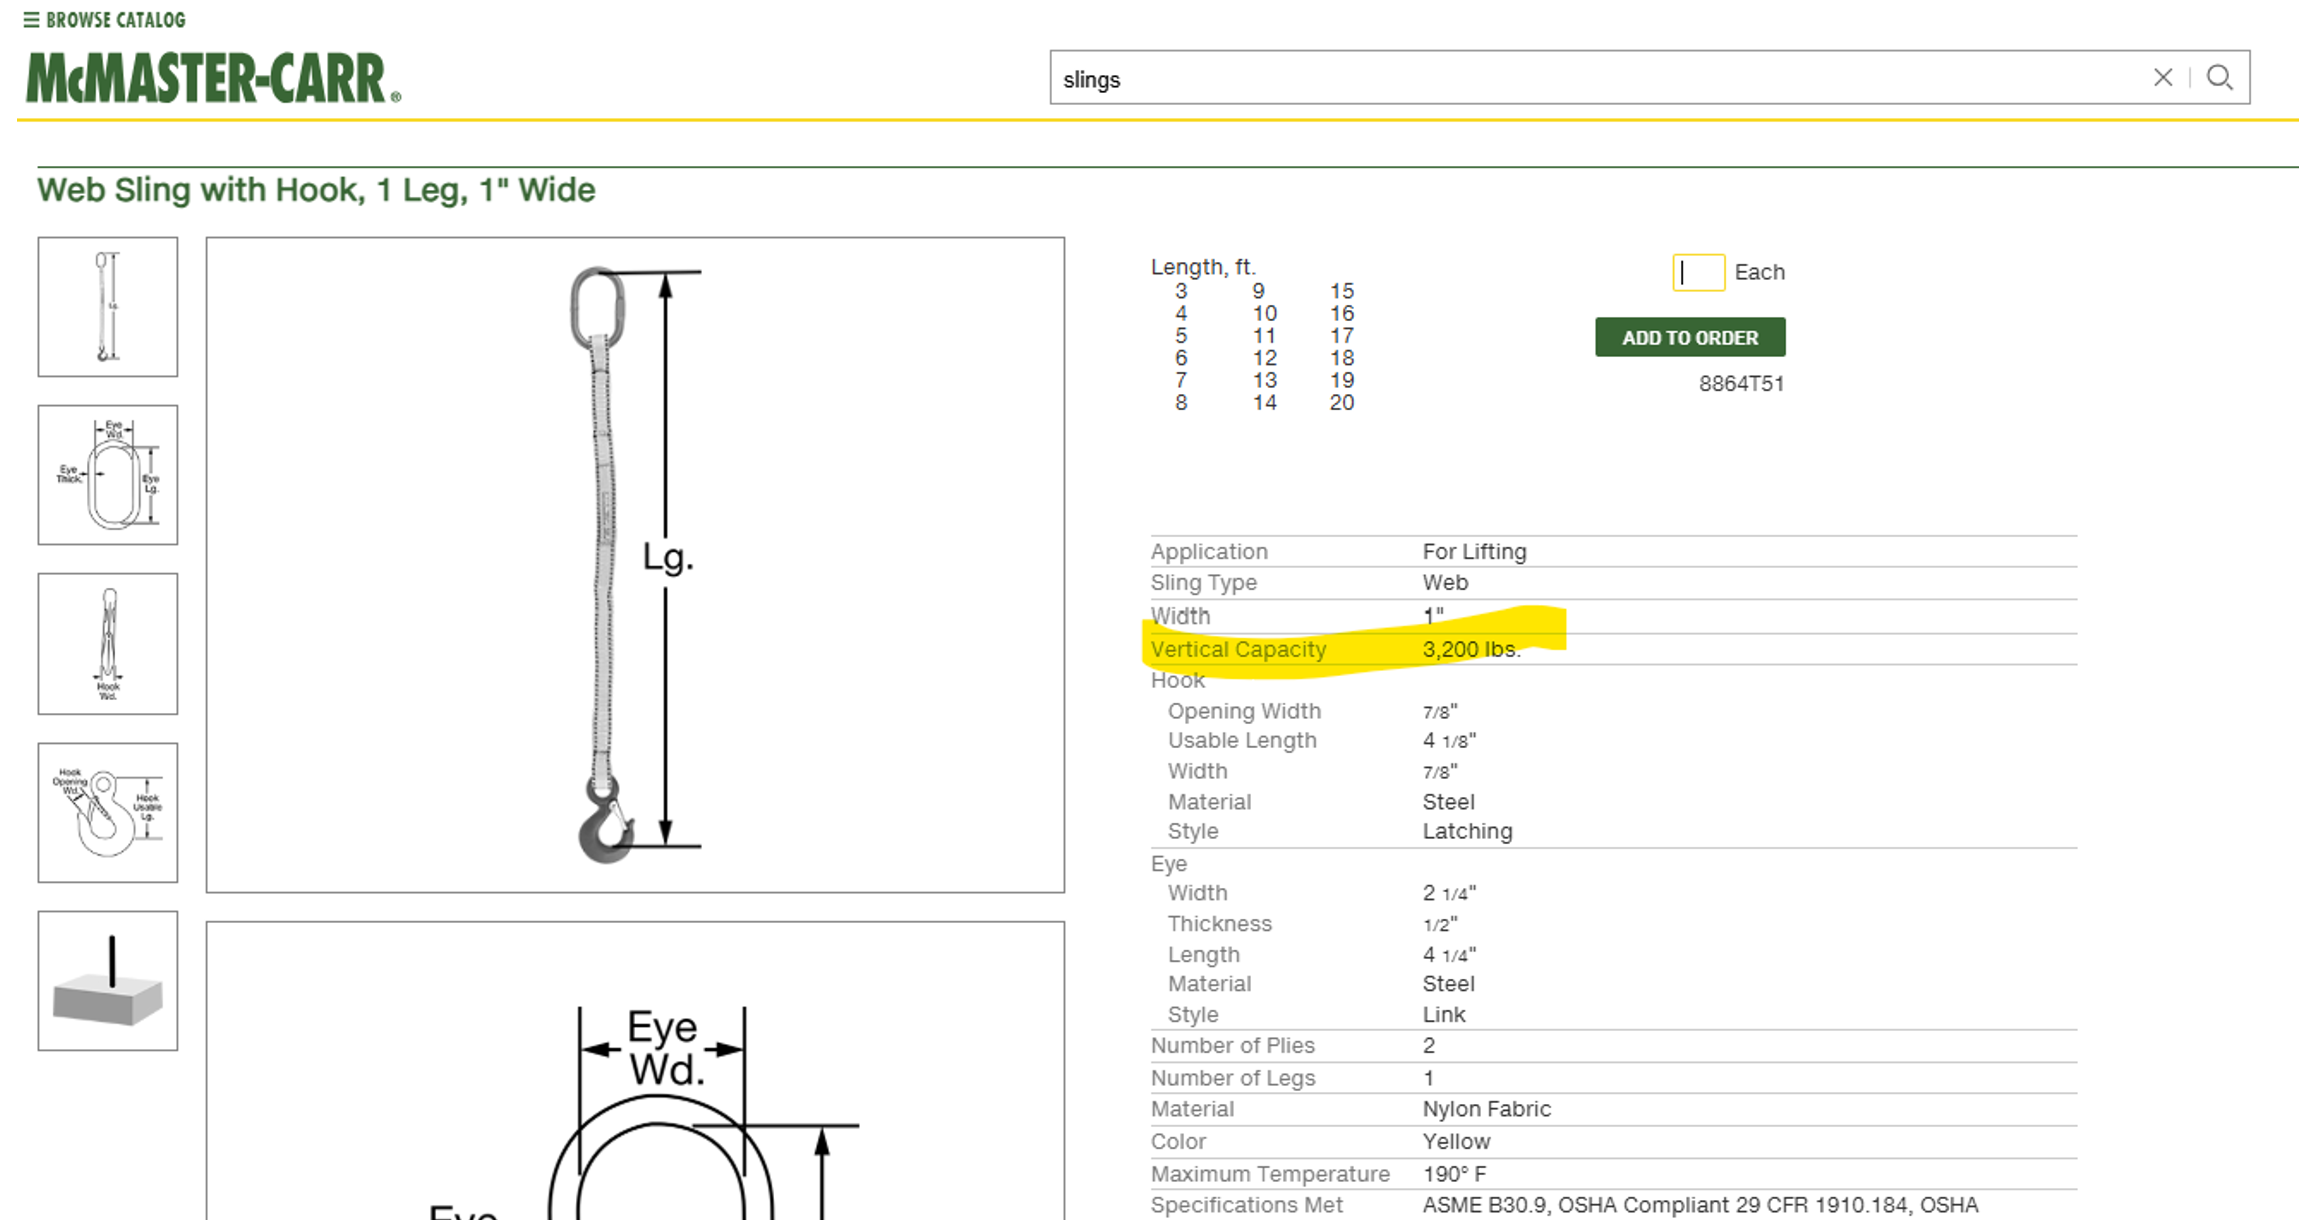
Depending on the industry or application, the acceptability of a design may be interpreted differently. For some applications showing a factor of safety of 4 may be sufficient. For example, a sling used for lifting, such as the one shown below, is specified to have a safety factor of 5 in ASME B30.9.
Load and Resistance Factor Design
In the civil/structural engineering industry, the variability of loading (wind, seismic, etc.) has been studied extensively. This is also true for various structural capacities in building materials like steel, concrete wood, etc. Given a loading and resistance that are both random variables, a simple “safety factor” does not result in a consistent level of probability of failure across all structures. The structural engineering industry addressed this inconsistency with a different design approach known as Load and Resistance Factor Design (LRFD.)
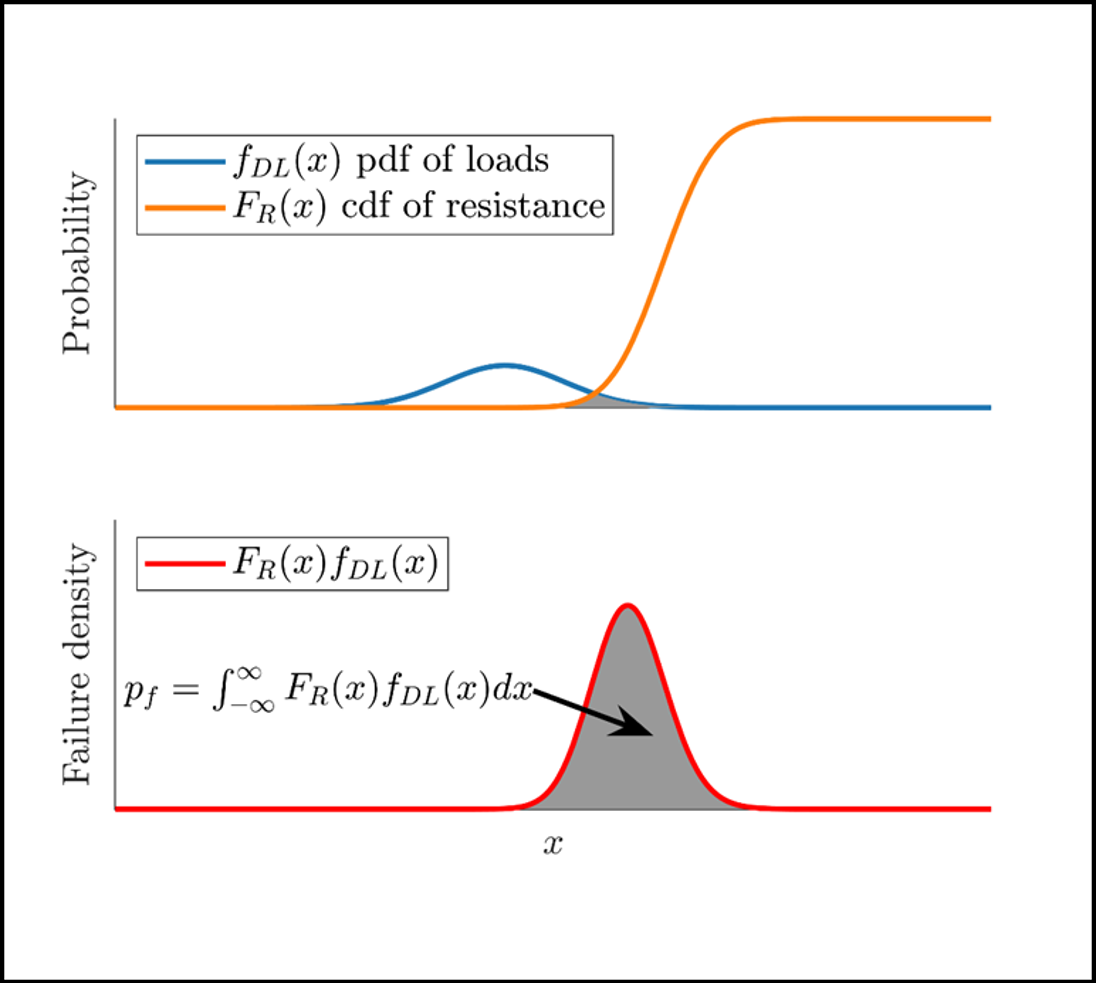
The intent of LRFD is to ensure a reasonably low probability of failure is met. The probability of failure can be calculated using the statistical distributions of loading and resistance. Finding the probability that loading exceeds capacity is equivalent to integrating the probability density function (PDF) of the loading multiplied by the cumulative distribution function (CDF) of the resistance (capacity). This can be thought of as accumulating the likelihood of all possible instances of loading being relatively high and the capacity being relatively low in order to find a cumulative probability of failure. The example plots shown below assume normal distributions of load and resistance.
For bridge design, both approaches are discussed in AASHTO LRFD and LRFD for Highway Bridge Superstructures Reference Manual Section 1.2.2.