Failure Theories
Failure of a material depends on (1) nature of loading and (2) type of material. There are theories that can predict material failure for complex states.Brittle Materials
Brittle materials are weaker in tension than shear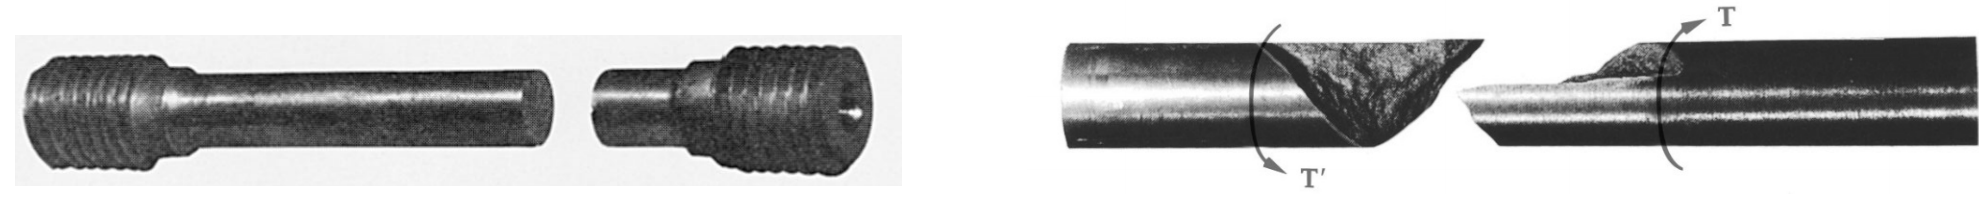
Maximum Normal Stress Criterion
For brittle materials, failure is caused by the maximum tensile stress and NOT compressive stress.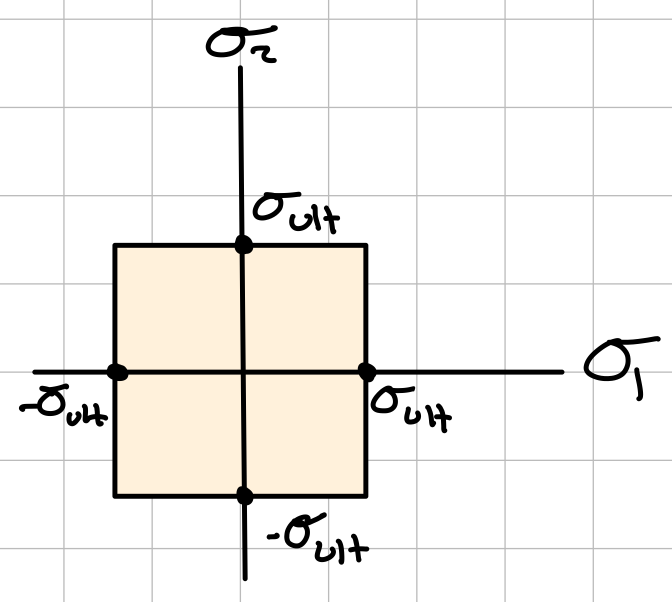
Ductile Materials
Ductile materials generally fail in shear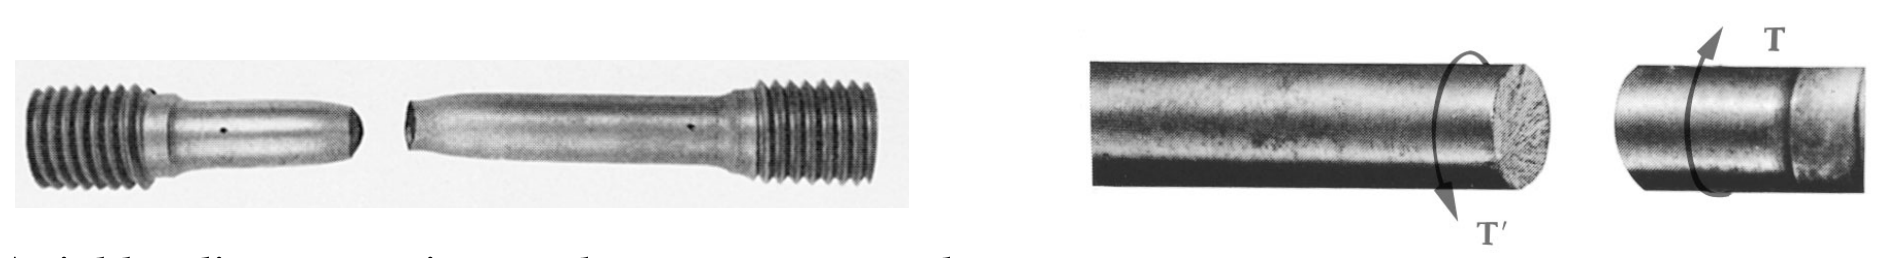
Maximum Shear Stress (Tresca) Criterion
If a material is ductile, failure is defined by yield stress (\( \sigma_Y \)) and occurs at max shear stress (\( \tau_{max} \)).Uniaxial Tension
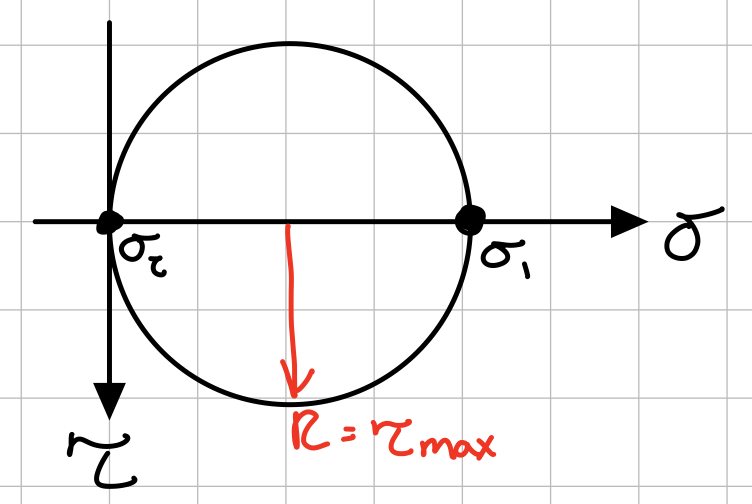
Extra!
Torsion of thin-walled hallow shafts builds on this content.
In general, the maximum shear stress is given by
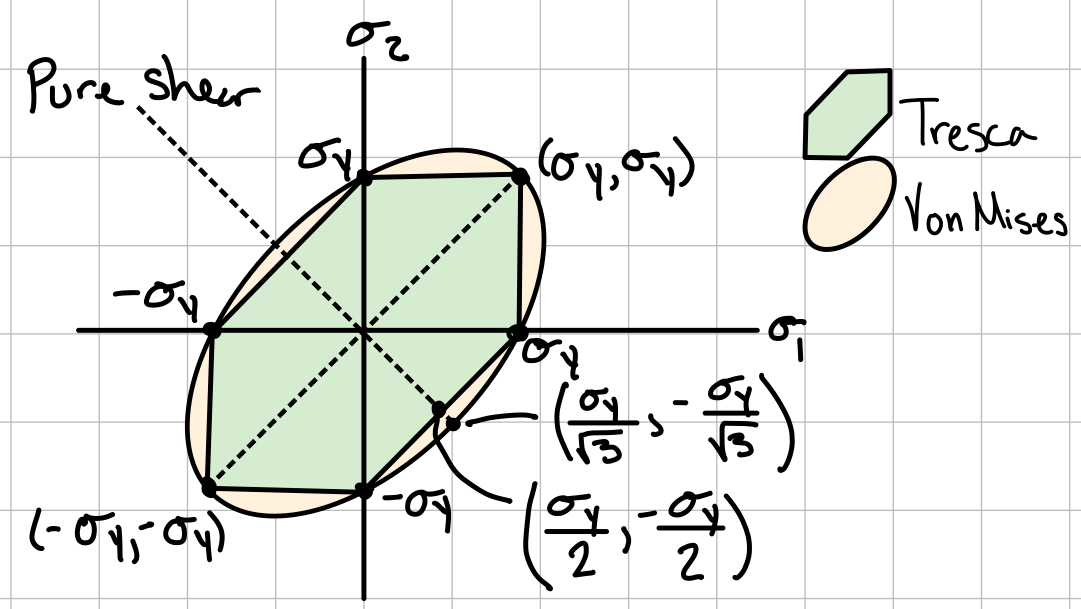
General 2D Loading State
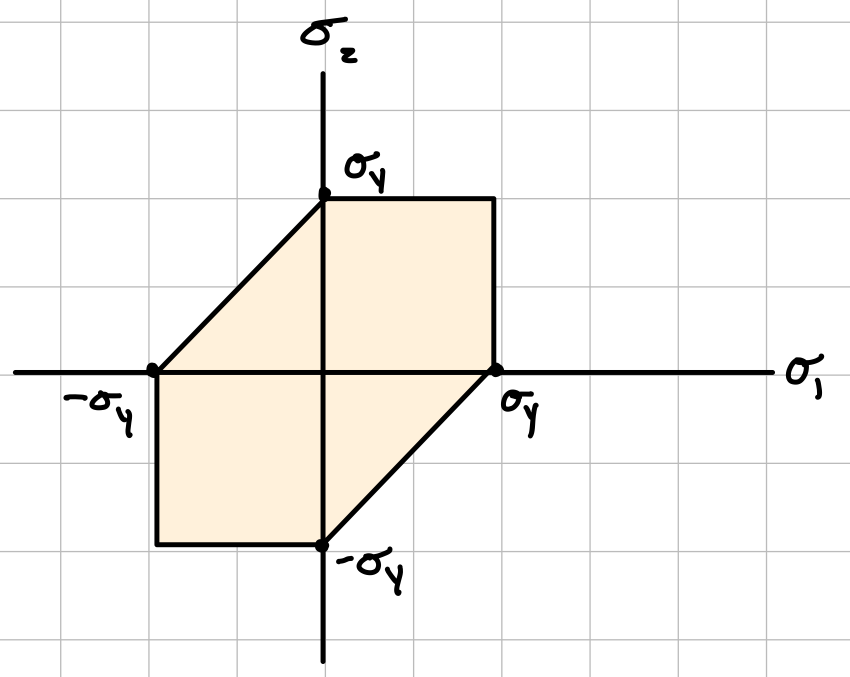
If \( \sigma_1 \) and \( \sigma_2 \) have the same signs:
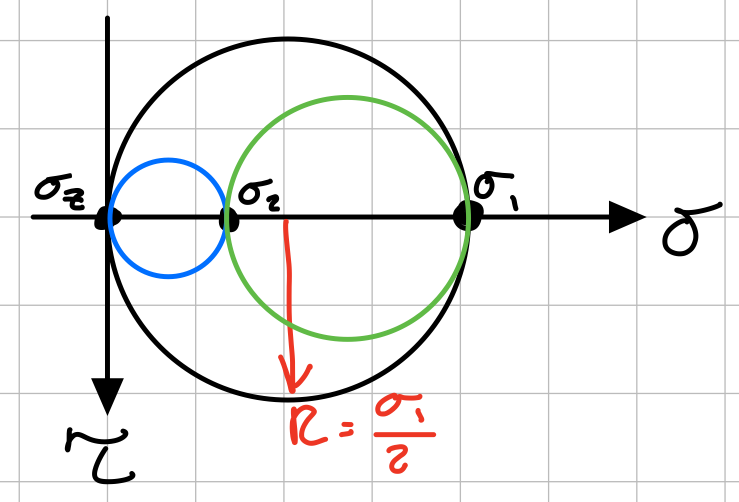
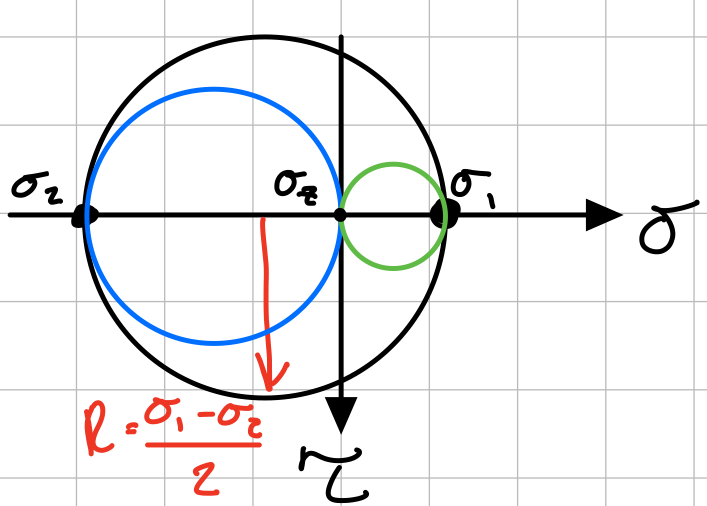
Note: These formulas operate under the assumption that \( \sigma_1 > \sigma_2 \), and \( \sigma_3 = \sigma_z = 0 \). For 3D loading scenarios, a more standard notation uses \( \sigma_1 > \sigma_2 > \sigma_3 \), where \( \sigma_3 \) is not necessarily \( \sigma_z \).
Maximum Distortion Energy (Von Mises) Criterion
Ductile materials likely do not fail due to stresses that only result in a volume change. It is hypothesized that failure is driven by distortion strain energy.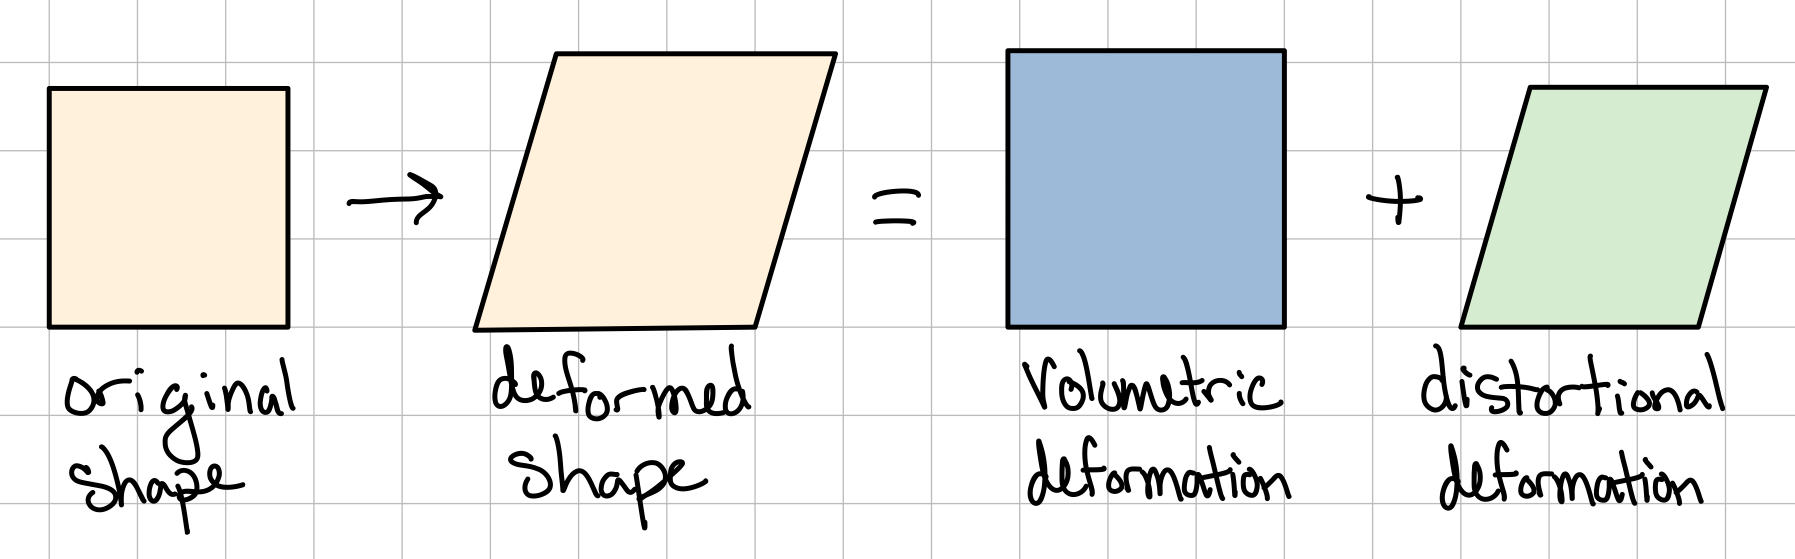
Interactive 3D Failure Surfaces
The following figure shows the failure surfaces of Tresca and von Mises criteria in term of the principal stresses in 3 dimensions. The 2D figure above can be found cenered around the origin in this plot. The shape of the 2D failure surface \( (\sigma_1,\sigma_2) \) remains the same, but moves location depending on \( \sigma_3 \). Just like in 2D, regions outside the surfaces are considered to have failed.
Extra!
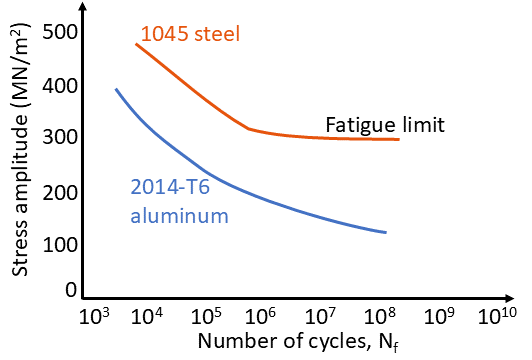
Fatigue builds on this content in Engineering Materials and Mechanical Design.